
How to read your Link analytics
Understand click volume, individual visits, sources, devices, and route outcomes without getting buried in charts.
6 min read
In this article
What to watch first
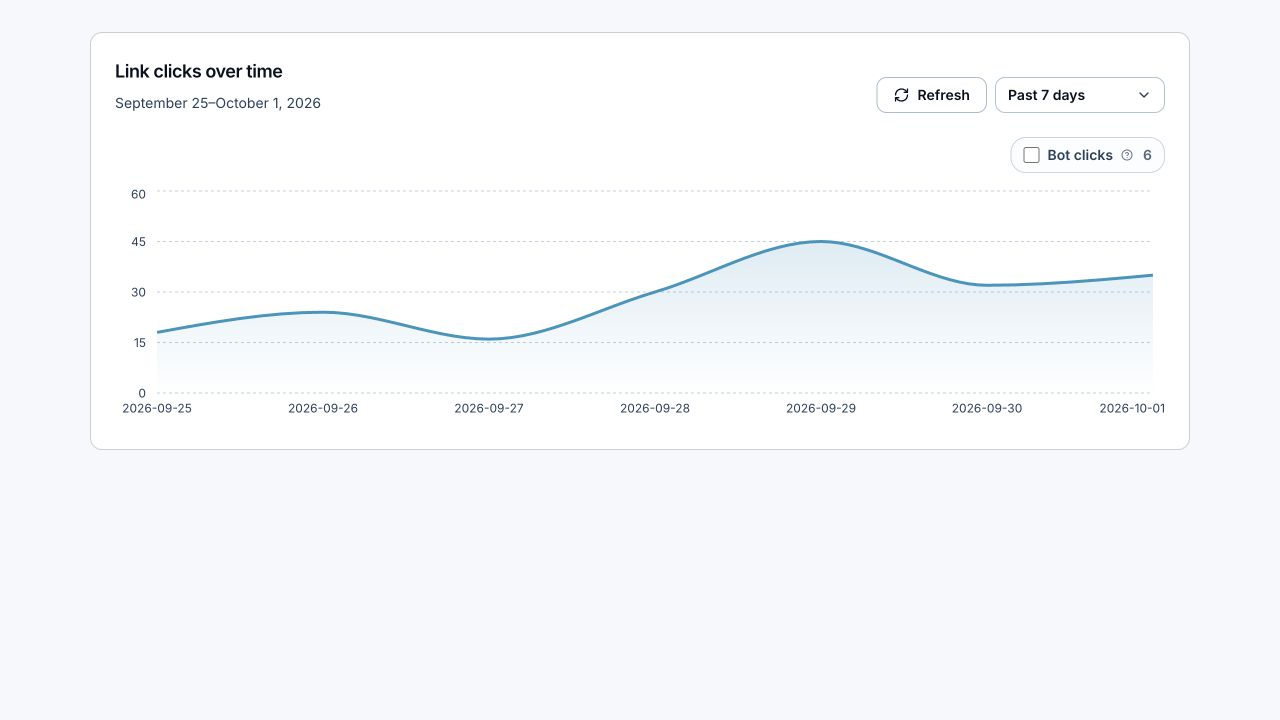
- Total clicks show volume.
- Click feed shows each counted visit, 10 at a time, for the selected date range.
- Country breakdown shows where routing coverage matters.
- Device breakdown helps app handoff decisions.
- Route outcomes show whether visitors hit exact matches or fallbacks.
Steps
- Open Links.
- Choose a Link.
- Review the main analytics summary.
- Click Refresh beside the date controls to load the latest available data without changing the range or filters.
- Scroll to Click feed to review individual clicks from newest to oldest.
- Use Previous and Next to move through 10 clicks at a time.
- Check countries and devices.
- Look for fallback-heavy traffic.
- Update routing if the data shows missed coverage.
Related articles
Still need help?
Support & feedback